malloc() is the go-to tool for requesting memory from the disk. When you write a program that uses dynamic memory allocations or create any data structre with the intent of changing its size at runtime, you use malloc() to define the size of the memory block you want to allocate. When the program gets executed, the kernel magically allocates this block of memory in the heap and returns a pointer to it. This memory can grow or shrink during execution, as per the needs of the program.
But how does malloc allocate this "memory block" in the heap? This is the topic of this post. The kernel does this using a memory allocator. The memory allocator is a program in iteslf in the sense that it is responsible for managing the memory in the system. It is responsible for allocating and deallocating memory, and for ensuring that the memory is used efficiently.
You might be wondering why we need dynamic memory allocation in the first place. Why not just use arrays? Well you are not alone. I used to think the same. I saw malloc() as a goofy black box. This was probably the same time when I had a stockholm syndrome thing for using languages with manual garbage collectors. Before jumping into the details of how malloc works, it's helpful to look at the memory architecture in a C program to understand why heap in the first place.
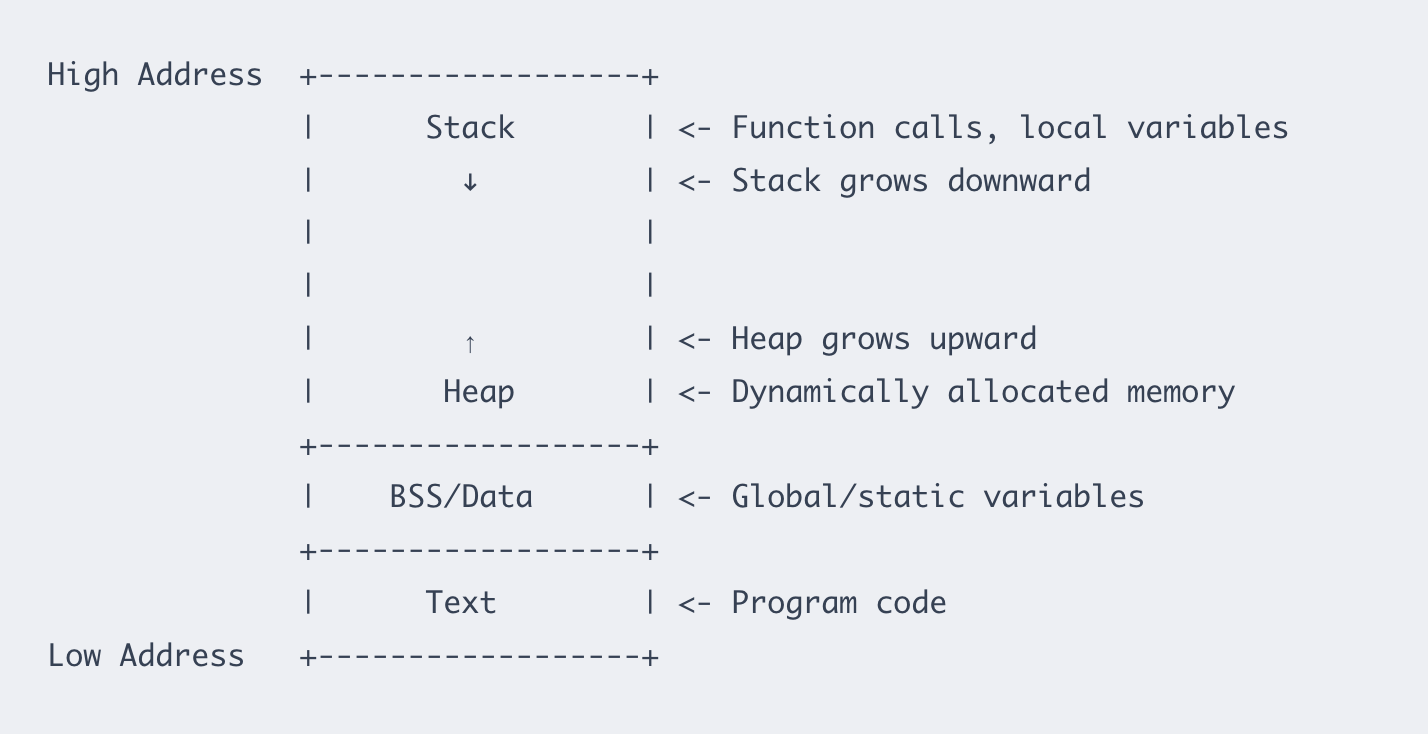
When your C program runs, the operating system allocates memory for it, divided into several segments: We will call it hierarchy of memory. Understanding the architecture will help us understand why dynamic allocation exists, and more importantly, when to use dynamic allocation. For starters, I recommend reading this to get a better understanding of the memory architecture in a C program. You just need to know what void* malloc(size_t size) does at the application level.
Once, the reason for using heap is clear, we can move on to the details of how memory allocators work. Different OSes have their implementation of memory allocators and functions like malloc() use APIs to request dynamic memory from the OS. You can loosely think of malloc() as a wrapper around the OS's memory allocator. I will talk about libmalloc–the memory allocator in macOS (15.6, used as of writing this post).
Memory allocators use system calls to request memory from the OS. The most common system call used is mmap(), legacy MAC systems use brk(). libmalloc almost always use mmap syscall. Under the hood, malloc() is layered over the Mach VM subsystem (which uses mmap-like calls via vm_allocate, mach_vm_map). The allocations are almost always from VM mappings, not classic sbrk().
To observe those calls live we can: (A) use DTrace/dtruss (but macOS SIP/entitlements often block it), (B) use vmmap + malloc_history + malloc env vars and libgmalloc – (what we will see), or (C) use Instruments.
So, when you call malloc(), the function checks the heap for a free block of memory of the requested size. If it finds one, it returns a pointer to it. If not, it extends the heap using mmap(). The heap allocations are divided into zones. macOS uses the zone system: nano / tiny / small / large zones. The nano allocator is a very low-overhead fast path for tiny objects; other zones are used for progressively larger objects.

Inspection of mach_vm_map / vm_allocate calls
Besides zones, malloc also has a number of facilites for debugging allocation errors in applications. These facilities are primarily controlled via environment variables. Once such facility is MallocStackLogging that records all allocations and deallocations in a log file, along with stack traces. We set it to vm to record VM allocations (mach_vm/mmap). Another useful one is MallocNanoZone which is set to 0 to disable the nano allocator. It makes behavior easy to trace in our case (we will see why).
We will write a program that allocates dynamic memory using void* malloc(size_t size) and inspect the calls to mach_vm_map and vm_allocate using malloc_history and vmmap.
// trace.c
#include <stdlib.h>
#include <string.h>
#include <stdio.h>
#include <unistd.h>

int main(void) {
    void *small[1000];
    for (int i = 0; i < 1000; ++i) {
        small[i] = malloc(64);
        if (!small[i]) { perror("malloc small"); return 1; }
    }

    void *big = malloc(10 * 1024 * 1024);
    if (!big) { perror("malloc big"); return 1; }
    memset(big, 0, 10 * 1024 * 1024);

    // print PID and a representative address
    printf("PID: %d  big=%p\n", getpid(), big);
    fflush(stdout);

    // keep process alive (120s)
    sleep(120);

    for (int i = 0; i < 1000; ++i) free(small[i]);
    free(big);
    return 0;
}
The sleep function is used to keep the process alive so that we can attach tools (vmmap, malloc_history). Before adding sleep, the program returned empty, possibly due to optimizer remobving calls or the program exited too quickly. If the program allocates and immediately exits, you won’t see the mapping calls unless you pause (sleep) the process so you can attach/observe.
Compile and run the inspection commands:
clang -g -O0 trace.c -o trace
MallocNanoZone=0 MallocStackLogging=vm MallocStackLoggingNoCompact=1 ./trace
This will return PID and a pointor to the start of the virtual memory block address allocated by malloc().
PID: 22022 big=0x12b000000
If you deference big, you get the actual value stored there. Note that this is a virtual address, not a physical address. This is the address malloc allocated on the heap structure. The actual physical address is not visible to the user. Getting the physical address on MAC is out of scope for this post. One important distinction I would like to make at this point is between virtual and physical addresses. Virtual addresses are the addresses that are used by the program to access memory. Physical addresses are the actual addresses of the memory in the system. Infact, we can compare the virtual memory and physical footprint of our program using vmmap.
Run vmmap -w <PID> from second terminal. This prints a hell lot of information. We will just foucs on a few of them – Virtual Size, Resident Size, Dirty Size, Swapped Size and Physical Footprint. Running vmmap -w 22022 returns a Physical footprint of 11.3M. The Malloc Zone has a virtual size of 19.0MB (1.7x the physical memory). 11 MB is the real RAM being consumed by the process. This includes everything: stacks, libraries, heap, etc.
To inspect heap allocations, we can use malloc_history.
malloc_history <PID> 0x12b000000
You'll see stack trace, which malloc zone, and the size of the allocation and whether the address was freed or not.
We saw how malloc is a layer on top of Mach VM. It may request larger VM regions from the kernel managed by libmalloc and subdivide them into zones. Finally, debugging tools (vmmap, malloc_history, stack logging) let us peek inside the allocator’s bookkeeping, but the physical memory is opague.