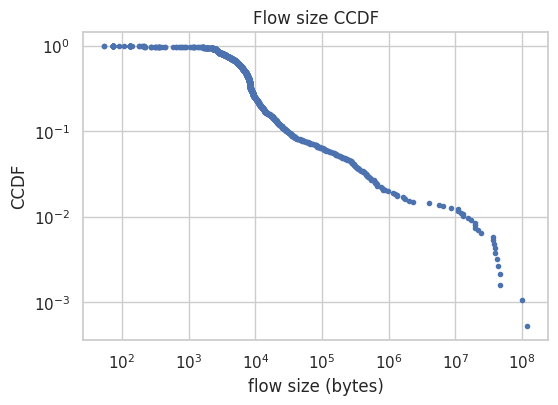
Leland demonstrated in “On the self-similar nature of Ethernet Traffic” that Ethernet traffic is self-similar, meaning irrespective of the timescale used to analyse ethernet frames, they look almost similar in pattern whether the timescale is 1 sec, 1 min, 10 mins, 10 hours. The pattern resembles a random burst like behavior followed by quiet times when very less frames are travelling. The pattern stays same even after aggregating multiple non-overlapping batches of ethernet traffic over long duration. This observation contradicted earlier methods of using probabilistic models that–due to thin-tailed distribution, tend to smooth out over time. Ethernet traffic is fat-tailed with infinite variance. HTTP/web-traffic also has self-similar property, which was discovered a year later in another paper “Self-similarity in World Wide Web Traffic” where they used MOSAIC browser to capture www traffic on their site.
Bottomline is: if you capture ethernet traffic for a long enough timescale, say a day or two, and zoom IN or zoom OUT of the picture, pattern stays the same – bursty, fractal and highly-variable. Self-similarity exists not only at muliplex levels but even at single-user level. Under normal usage conditions, network traffic is comprised of ON (active) phase and OFF (idle) phase. These are heavy-tailed and batches of packets within ON period travel in a fractal-like cluster.
The burstiness of traffic is a property of the traffic sources themselves, and persists over an extremely wide range of time scales. Aggregations of many such sources retain this burstiness, violating the assumptions of traditional Poisson traffic models.
I tried to reproduce the results from the paper with a much smaller dataset–1 hour of Wi-Fi traffic on my laptop (interface en0) and extracted high-resolution timestamps (frame.time_epoch), packet sizes (frame.len), and basic addressing/port information (ip.src, ip.dst, tcp.srcport, tcp.dstport). Using these, I constructed packet-count and byte-count time series across bin sizes 1 ms to 100 s. Unlike the original Leland et al. Ethernet study—which used shared-medium Ethernet taps collecting all traffic from many hosts—my dataset represents the view of a single host on a Wi-Fi network, with access only to its own unicast traffic and local broadcast/multicast frames. As a result, my trace is smaller in volume, and reflects modern application patterns rather than 1990s LAN workloads. Despite these differences, the statistical methods applied are identical. Python code is available here.
Capture packets using tshark (wireshark installed) and save to csv:
sudo tshark -i en0 -T fields -E header=y -E separator=, \
  -e frame.time_epoch -e frame.len -e ip.src -e ip.dst -e tcp.srcport -e tcp.dstport \
  > capture.csv
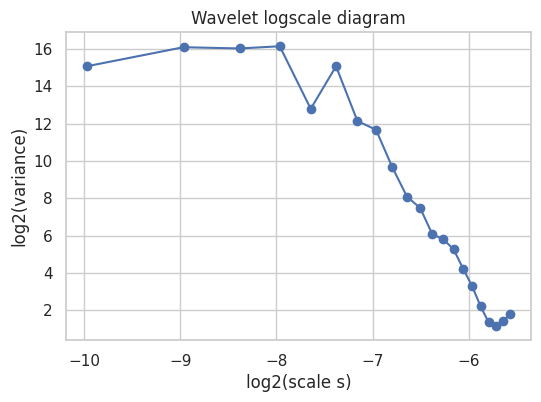
These conclusions apply only to the specific capture conditions (Wi-Fi interface, single host perspective, one-hour window), and cannot be assumed to generalize beyond the measured time scales or to the network as a whole. However, within this empirical scope, the results are consistent with the core phenomena reported in earlier Ethernet self-similarity studies.